Pitfalls to avoid
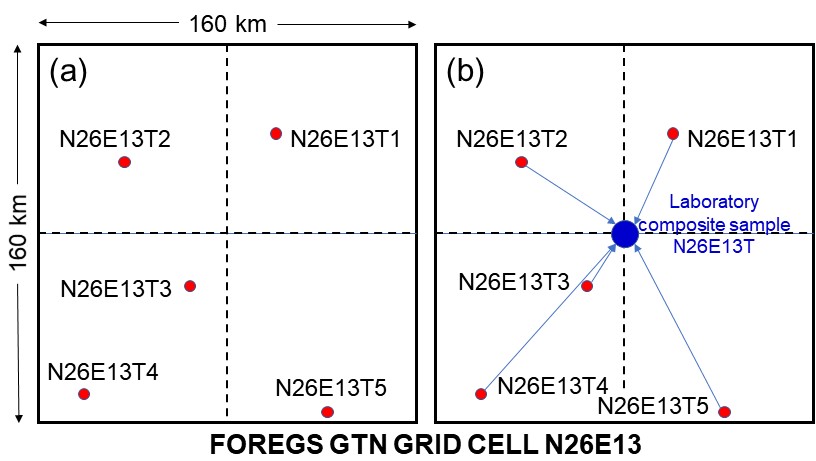
Darnley et al. (1995) were forced to include in this important reference work a Chinese procedure of making laboratory composite samples by mixing equal weights of the 5 or 8 natural individual samples of each GTN grid cell of 160x160 km, and giving to the resulting artificial laboratory composite sample the coordinates of the grid cell centre (see Figure below). This illogical procedure must not be used, because firstly the integrity of each sample is lost, and secondly it is not in agreement with the objective of the global project to establish a global Geochemical Reference Network of permanent value similar to a geodetic network in order to level the results of more detailed regional geochemical surveys.

For additonal details about pitfalls to avoid, the following bibliographic reference should be consulted:
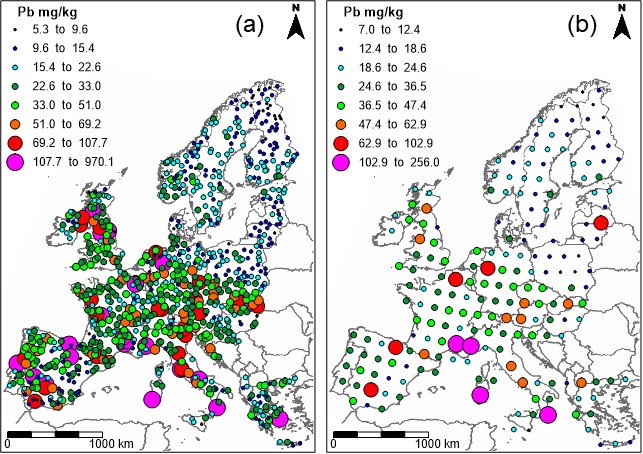
The following two maps from the FOREGS project of the Geochemical Atlas of Europe show the distribution of Pb in topsoil of the original 843 topsoil samples and the 198 artificial laboratory composite samples made in the laboratory of the Institute of Geophysics and Geochemistry (Langfang, China), respectively. The difference in the spatial Pb distribution is obvious even to non-expert eyes. The detail spatial patterns of Pb, displayed by the analyses of the original 843 topsoil samples (Figure 'a' on the left), is not shown in the ‘over simplified’ map with only 198 artificial laboratory composite samples (Figure 'b' on the right). In fact, the uniqueness and integrity of the individual samples has been completely destroyed by “artificial compositing in the laboratory”, and their geographical reference to the actual sampling site eradicated by “assigning new arbitrary coordinates”. It can be concluded, therefore, that the procedure of compositing individual natural samples to make laboratory composites, does not meet the requirements for the establishment of a global Geochemical Reference Network, similar to a geodetic network (Darnley et al., 1995), and must no longer be used. In fact, compositing natural samples to make artificial laboratory samples must not be used in any geochemical survey for the purposes of reducing analytical costs. This wrong procedure enforced by the Chinese co-author is recognised in Darnley et al. (1995) as it is stated that "Individual samples from within each cell of the reference network should be analysed at the earliest opportunity". This was the compromised solution that Arthur G. Darnley found at the time in order to proceed with the finalisation and publication of the Darnley et al. (1995) report.


